 |
|
<< Pulse para mostrar la Tabla de Contenidos >> LTE CAPACITY RESULTS |


|
|
|
<< Pulse para mostrar la Tabla de Contenidos >> LTE CAPACITY RESULTS |
|
|
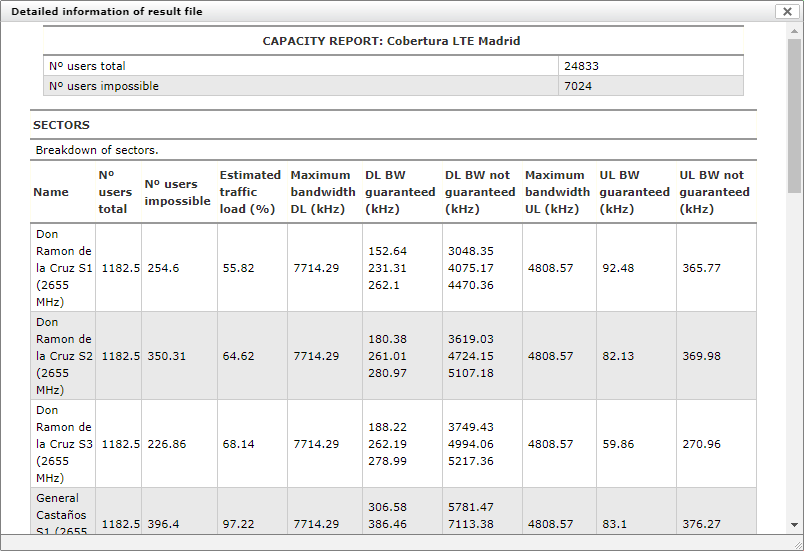
The result of LTE capacity analysis in Xirio provides a detailed report of the demand for network resources for three traffic load values (0%, 100% and the one estimated by the user) as well as total number of users on the stage and those that are impossible to attend. The bandwidth reports presented have detailed information for each transmitter, indicating maximum BW, estimated traffic load, BW at the edge, BW at the center (for downlink and uplink, both guaranteed and unsecured traffic), total number of users and total number of users unable to attend.
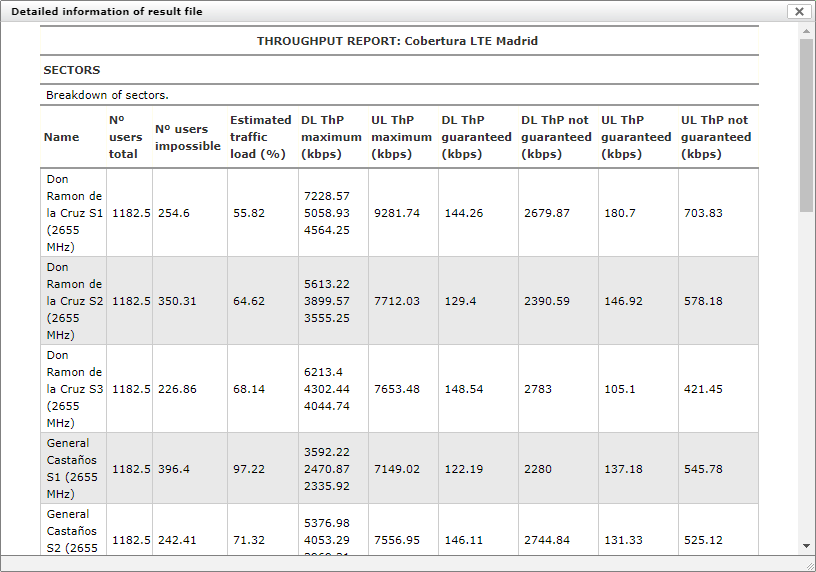
The throughput reports presented have detailed information for each transmitter, indicating maximum throughput, estimated traffic load, edge throughput, throughput at the center (for downlink and uplink, both guaranteed and unsecured traffic), total number of users and total number of users unable to attend.
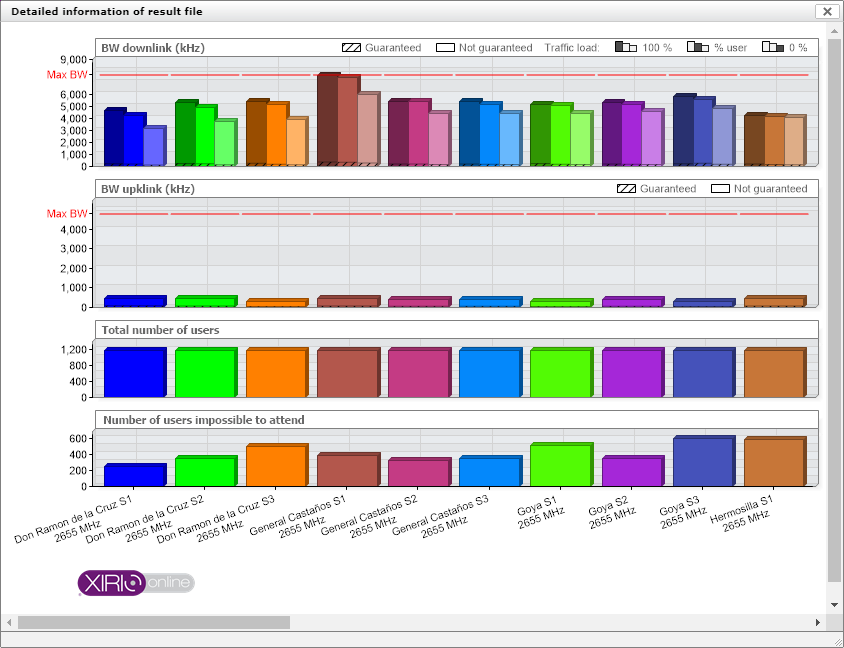
In addition a serie of graphic results are obtained, which offer this same information in a visual and easier to understand way. The first one gives a representation of available and required bandwidth to each transmitter, both for resources dedicated to the cells center and edge, as well as the uplink and downlink.
Xirio graphically shows the bandwidth results using 6 plots, as follows: •The first 4 details data for the downlink and uplink channel. For each transmitter, 3 different situations are presented. The first one (left bar) would be 100% traffic load, the next one would be traffic load value that user has previously defined and the last one would be 0% traffic load.
•Plot of users total number. It shows the estimate number of users that each transmitter will have to attend. •Plot of number of users unable to attend. Finally, the number of users who will not have service is presented, either because SINR is insufficient or because traffic demand is too high for that transmitter.
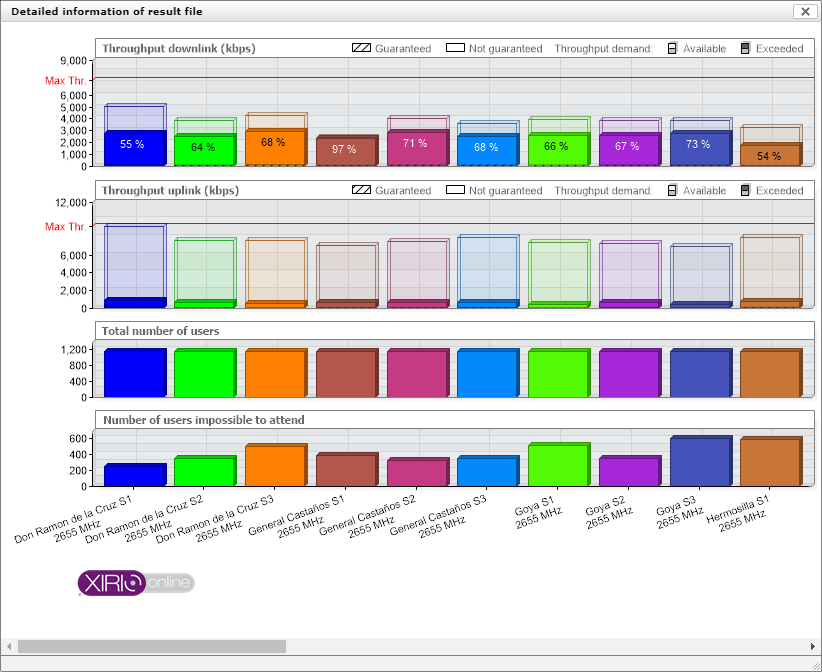
The second one offers a similar result from the throughput point of view able to generate transmitters of the study. In this result, it is easy to identify the most saturated stations and those with the lowest traffic load.
In the same way that for the bandwidth case, 6 plots are presented with the results of throughtput demand: •The first 4 details data for the downlink and uplink channel. For each, the maximum throughput reached by the sector with the least interference is established with 0% traffic load (red line).
•Plot of users total number that is able to service each transmitter. •Plot of users total number that is not able to serve the transmitter due to a very low SINR or to a too high throughput demand for that transmitter. |