 |
|
<< Pulse para mostrar la Tabla de Contenidos >> MULTITRANSMITTER COVERAGE STATISTICS CALCULATION |


|
|
|
<< Pulse para mostrar la Tabla de Contenidos >> MULTITRANSMITTER COVERAGE STATISTICS CALCULATION |
|
|
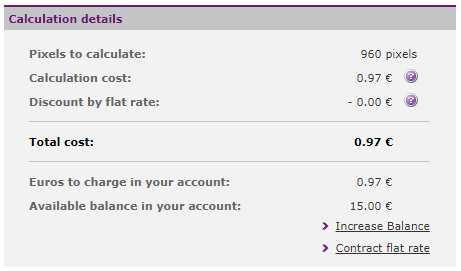
The multi-transmitter coverage statistics calculation is a detailed report for each toponym (regions, municipalities, populated centers, etc.) with percentages of population and area covered for each range. To perform a calculation like this it is necessary to have previously obtained a multi-transmitter coverage result at high resolution. This functionality is not available for free coverage simulations. The easiest way to find out this calculation price is to click on Multicoverage Actions window "Coverage statistics calculation". Xirio will automatically estimate the calculation cost of the study showing it in a new window. The user confirmation is required before discounting this amount to the balance.
It is possible that the first time you make a calculation like this the neccesary cartography will not be selected. The user only has to select the desired geopolitical layer. It is posible that several layers are available for the same area. There are three coverage statistics types for multi-transmitter coverage in Xirio: •Population and area. Calculates a statistic for population and area covered by all transmitters without specifying which transmitter covers every toponym. •Population and area by best server. Calculates a statistic for population and area covered by all transmitters specifying which is the best server for each toponym. •Population and area by transmitters. Calculates a statistic for population and area covered by all transmitters specifying which transmitter covers every toponym.
In addition, the user can select the following additional options for the generation of coverage statistics: •Show entities without coverage in statistical report. By default, features without coverage are removed from the report. When this option is selected, all of these features will appear in the report with a zero covered area and population. In any case, the entities shown in the report will continue to be those that overlap with the calculation area. •Add statistical data to the report. When this option is selected, a set of statistical indicators for each entity are detailed in the report. Minimum, maximum, average, percentile values at 50%, 70% and 90% are shown, both for population and area. •Limit statistics to service area. When this option is selected, all signal values where there is no service will be ignored, that is, it is necessary that the best server exceeds its reception threshold. This option has an effect only on the population and area statistics. Does not apply to statistics by transmitters. |