 |
|
<< Pulse para mostrar la Tabla de Contenidos >> DIGITAL HOP REPORT |


|
|
|
<< Pulse para mostrar la Tabla de Contenidos >> DIGITAL HOP REPORT |
|
|
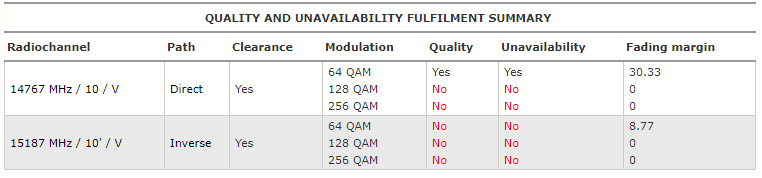
It contains all the information related to the radio link quality and viability. In the beggining, it presents a summary table, where user can verify, for each link radio channel and each modulation, if clear link condition, quality and unavailability objectives are satisfied. Also, in this table the user can check fadings that have been calculated.
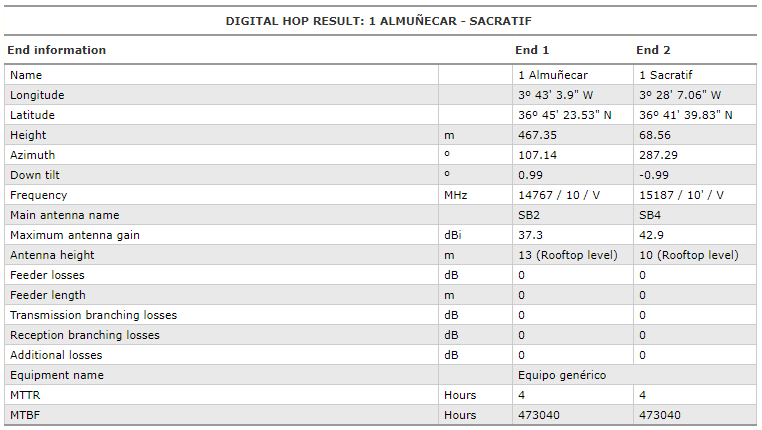
Following fulfilment table, it is presented the calculation breakdown for the worst radio-channel (with lower fading) contemplating all active modulations. This calculation breakdown has the following sections in this order: 1.Link ends data: This section breaks down all data configured at each end and that have been contemplated in calculation such as coordinates, antenna heights, antennas, equipment MTBF, etc.
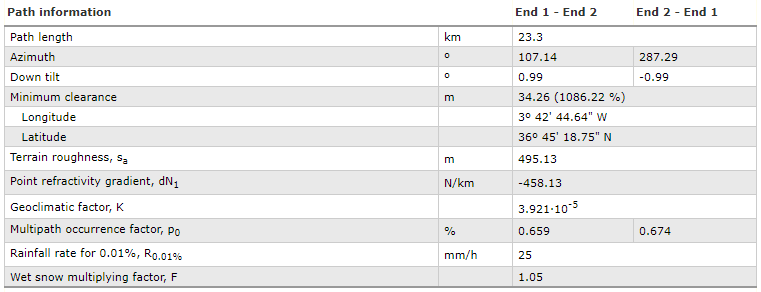
2.Path data: This section breaks down the geo-climatic, geographical or positional data that affect calculation, such as link distance, azimuth, tilt, less clearing, refractivity gradient, etc.
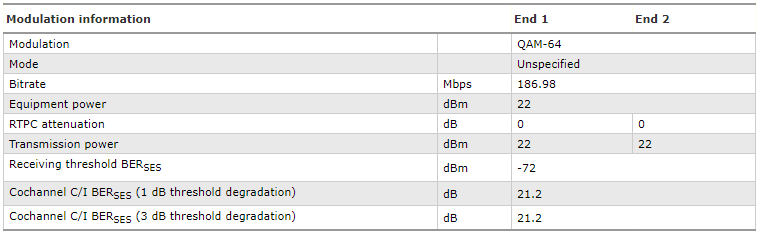
3.For each active modulation: a.Modulation data: Modulation type, nominal power, manual attenuation PSTN, real transmission power, etc.
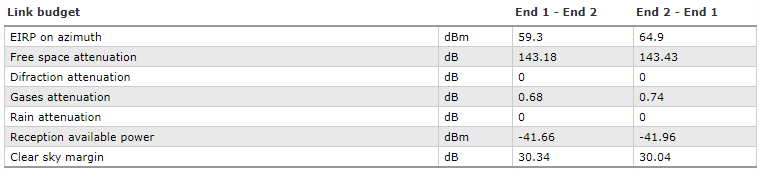
b.Link balance: For each path, EIRP and path attenuation is broken down due to various mechanisms such as free space propagation, diffraction attenuation in obstacles, gas attenuation, etc.
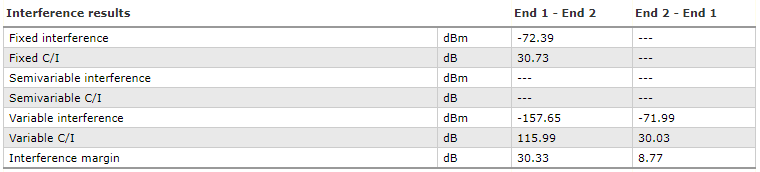
c.Interference Result (optional): In case that link has been calculated within a Transport Network study, this section will be in the report. It breaks down the total interference received in each end by categorizing them as fixed, variable and semi-variable:
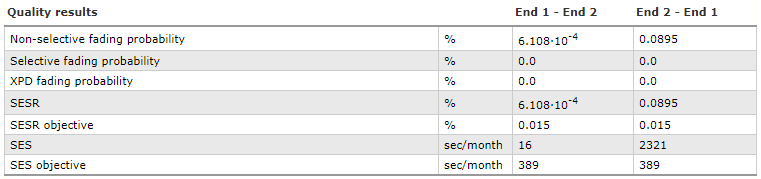
d.Quality result: Final result of link viability percentages that have been used for quality calculation, as well as comparison with objectives established in the study.
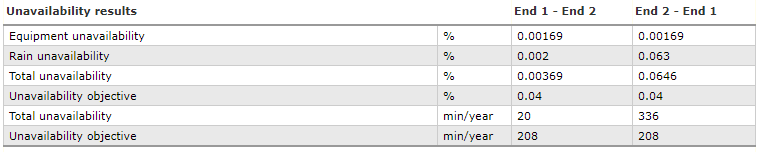
e.Unavailability result: Final result of unavailability percentages that have been used for its calculation, as well as comparison with objectives established in the study.
The digital hop report can be viewed and downloaded to the computer from Actions window, after selecting it in the legend tree. File will be download in HTML format, this format can be opened directly from Microsoft Excel to analyze it. |