 |
|
<< Pulse para mostrar la Tabla de Contenidos >> LINK GRAPH |


|
|
|
<< Pulse para mostrar la Tabla de Contenidos >> LINK GRAPH |
|
|
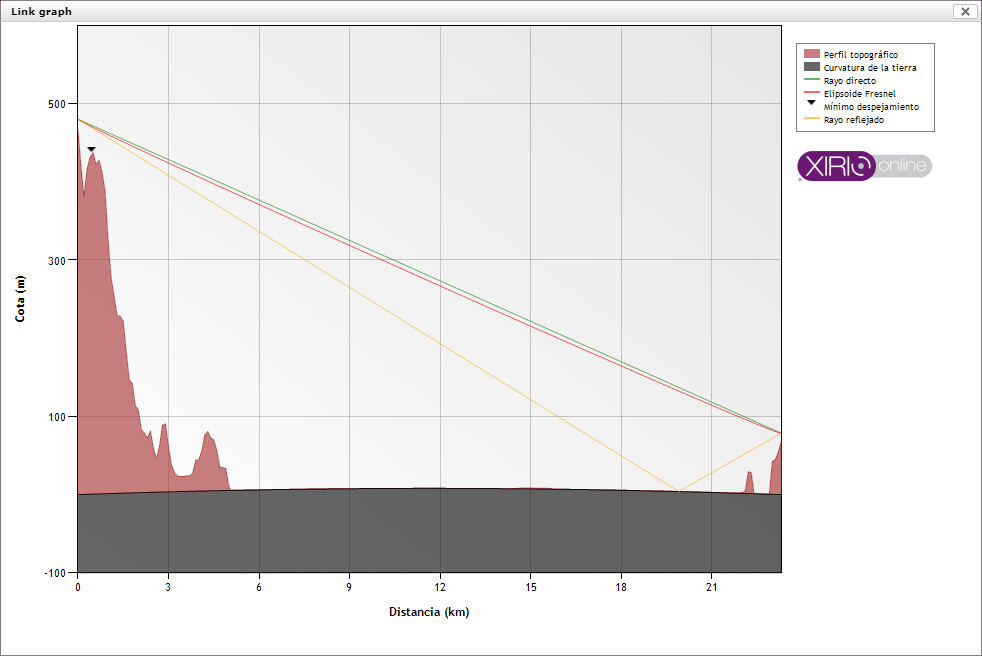
Graphic representation of the topographic profile including direct ray, Fresnel ellipsoid, signal level and height corrections if morphographic layer is used.
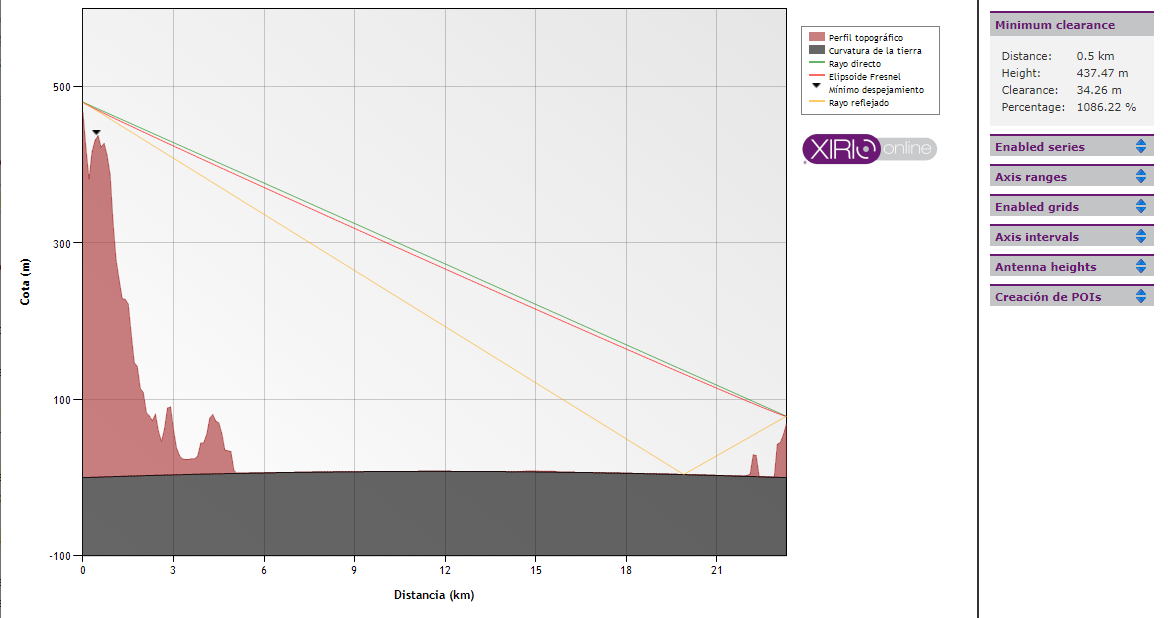
The link graph can be viewed and downloaded to the computer from Actions window, after selecting it in the legend tree. The advanced link graph is an interactive element that allows the user to perform certain actions on the representation of the link graph. This chart is only available for high resolution (not free) calculations via the "Open" option in the action panel, after selecting "Link Chart" in the legend tree. This advanced graphic represents the same elements as the standard link graphic, but also incorporates in the right part of the interface a toolbox that contains a series of modules with different functionalities that allow the interaction with the graphic. These modules provide information on the minimum clearing point, allow you to show/hide the series represented in the graph, change the ranges of the axes to zoom in on the graph, show/hide the grids of each of the axes and change the interval of spacing of the axle grids.
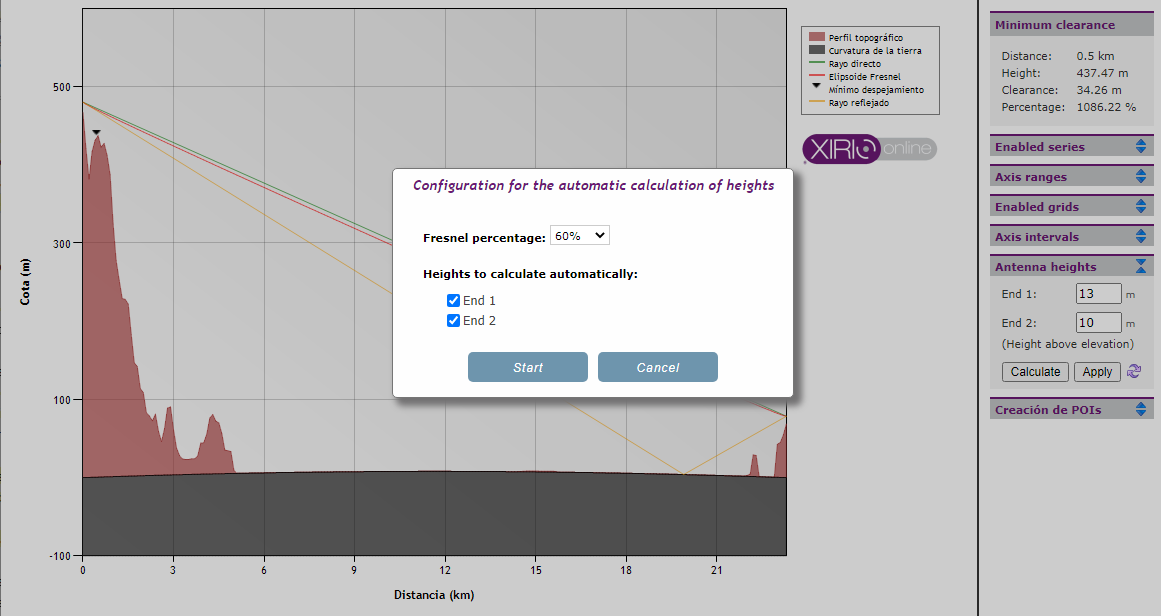
In addition, two other very useful features are offered to the user: modifying the height of the antennas and creating POIs. The first of them allows to modify the height of one or both ends in the graph of manual or automated form (by means of a calculation of heights specifying the percentage of fresnel and the ends to calculate); the new heights can be saved at the ends of the link using the "Apply" button; a button is also provided to retrieve the last saved heights at the ends of the studio. The second functionality allows you to create a POI in the viewer at a certain distance from the transmitter (eg to mark the point of minimum clearance in the viewer)
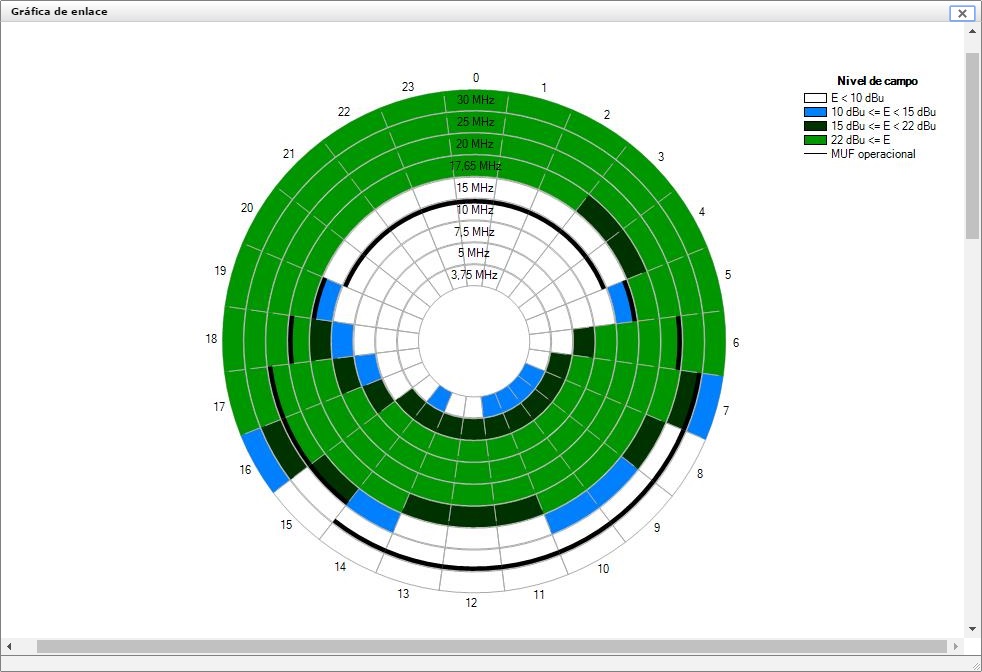
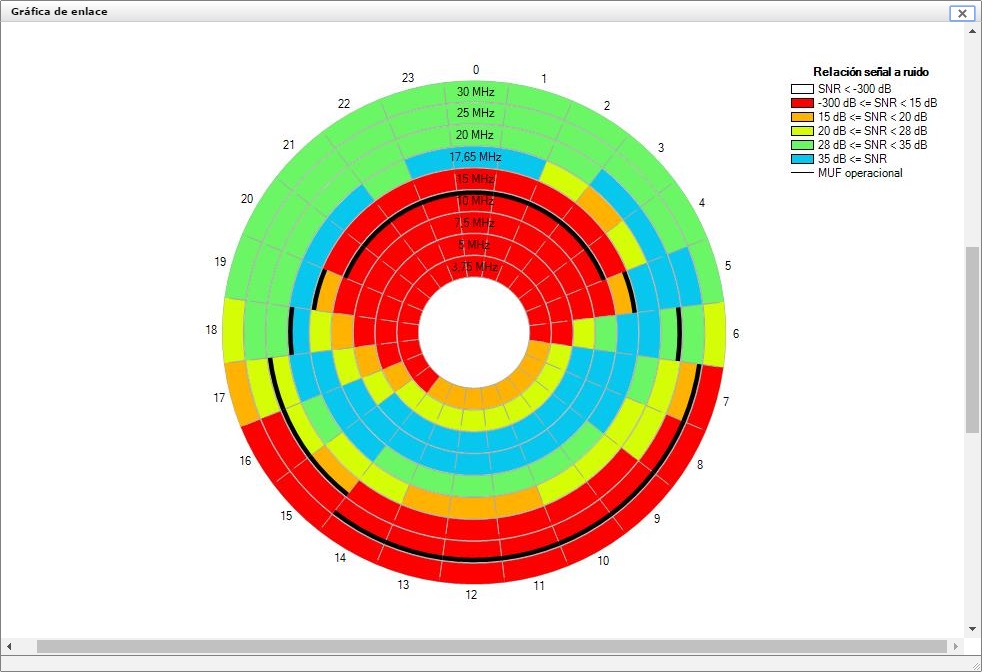
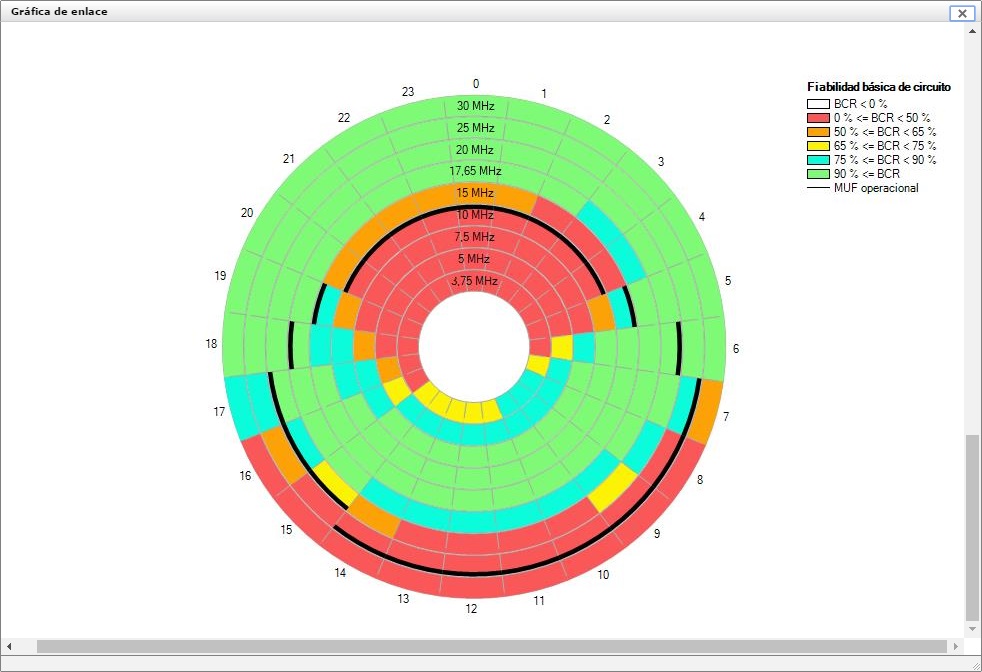
GRÁFICA DE ENLACE ESPECÍFICA DEL SERVICIO HF The profile graph with HF service consists of three circular figures representing the signal level, the SNR and the circuit reliability. Each of the results is plotted for a frequency range spanning the entire HF band and for 24 hours a day. In addition, the three figures represent the value of the MUF.
This graph can also be viewed and downloaded to the user's computer from the action panel, after selecting it in the legend tree. |